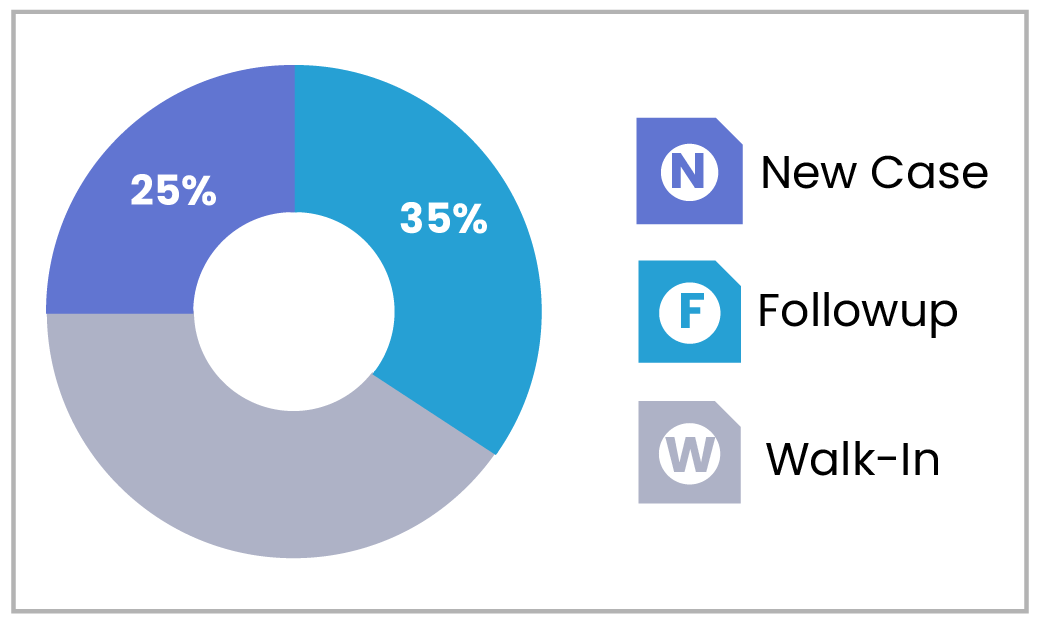
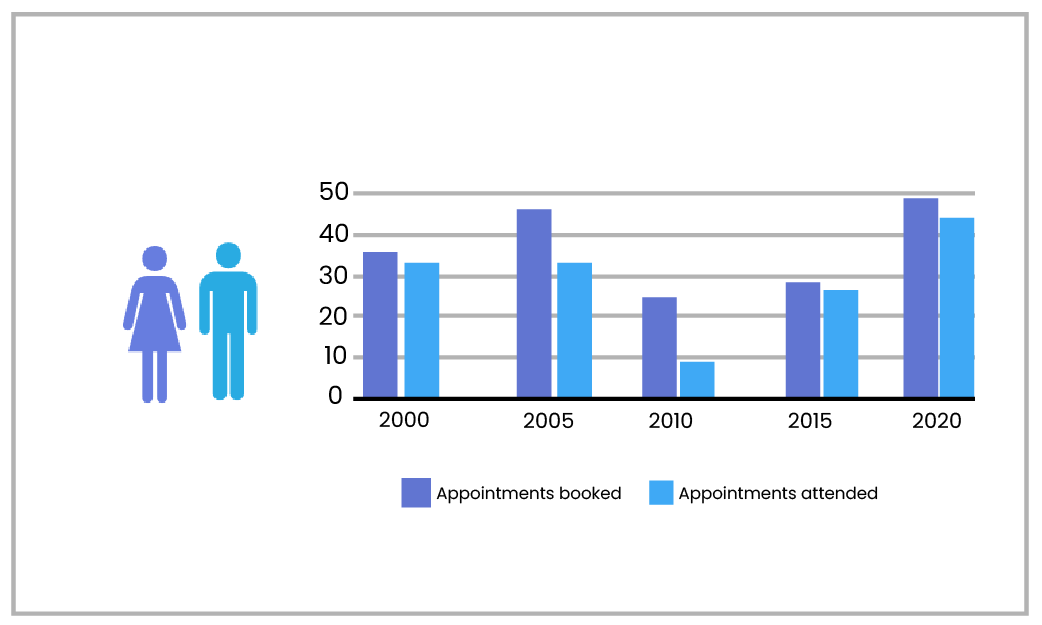
Ensure you have access to all of your key preformance indicators in one place to get a quick snapshot of all your operations.
Reporting made easier
We help you understand your healthcare operations by providing systems that help you navigate through your information with just one click. This allows you to see the bigger picture and understand what’s creating it. Our systems deliver dashboards, reports, charts, graphs, data-driven maps, and calendars, all of which are live.
Grouping, pivoting, totals, and sorting with drag-and-drop functionality
User or group-specific constraints
Seamless connection to any SQL database
Integration of information across applications and business processes